


UK Inflation
Today, during the first half of the European trading day, the spotlight falls on the United Kingdom, where the country will be releasing its inflation figures for the month of July. The headline YoY CPI is expected to have gone up by a tenth of a percent, from +2.4% previous to +2.5% expected. If the number comes out in line with expectations, then this would be half a percent more than the Bank of England inflation target of +2.0%. But the bank is still ok with that as they understand that there are some external factors, that keep inflation above the bank’s target rate. Higher energy prices and sterling’s depreciation are one of the main contributors to higher inflation numbers, according to the BoE.
In addition to the headline inflation, UK will release the core YoY CPI numbers as well, which are expected to come out the same as the previous at +1.9%. Looking back a month ago, when everyone was expecting the core CPI to increase from +2.1% to +2.2%, and in the end it came out below the forecast, this time the economist and analysts took a more modest approach, and are aiming for the same number as the previous. The core CPI excludes food and energy prices, and according to the BoE’s view over the rise in energy prices and depreciating pound, it explains why the headline is expected to have risen and the core inflation to remain the same.
GBP/CHF – Technical Outlook
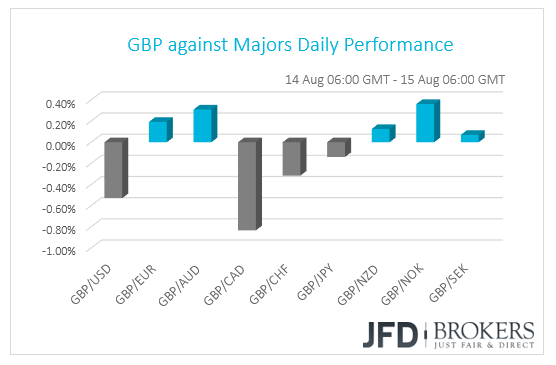
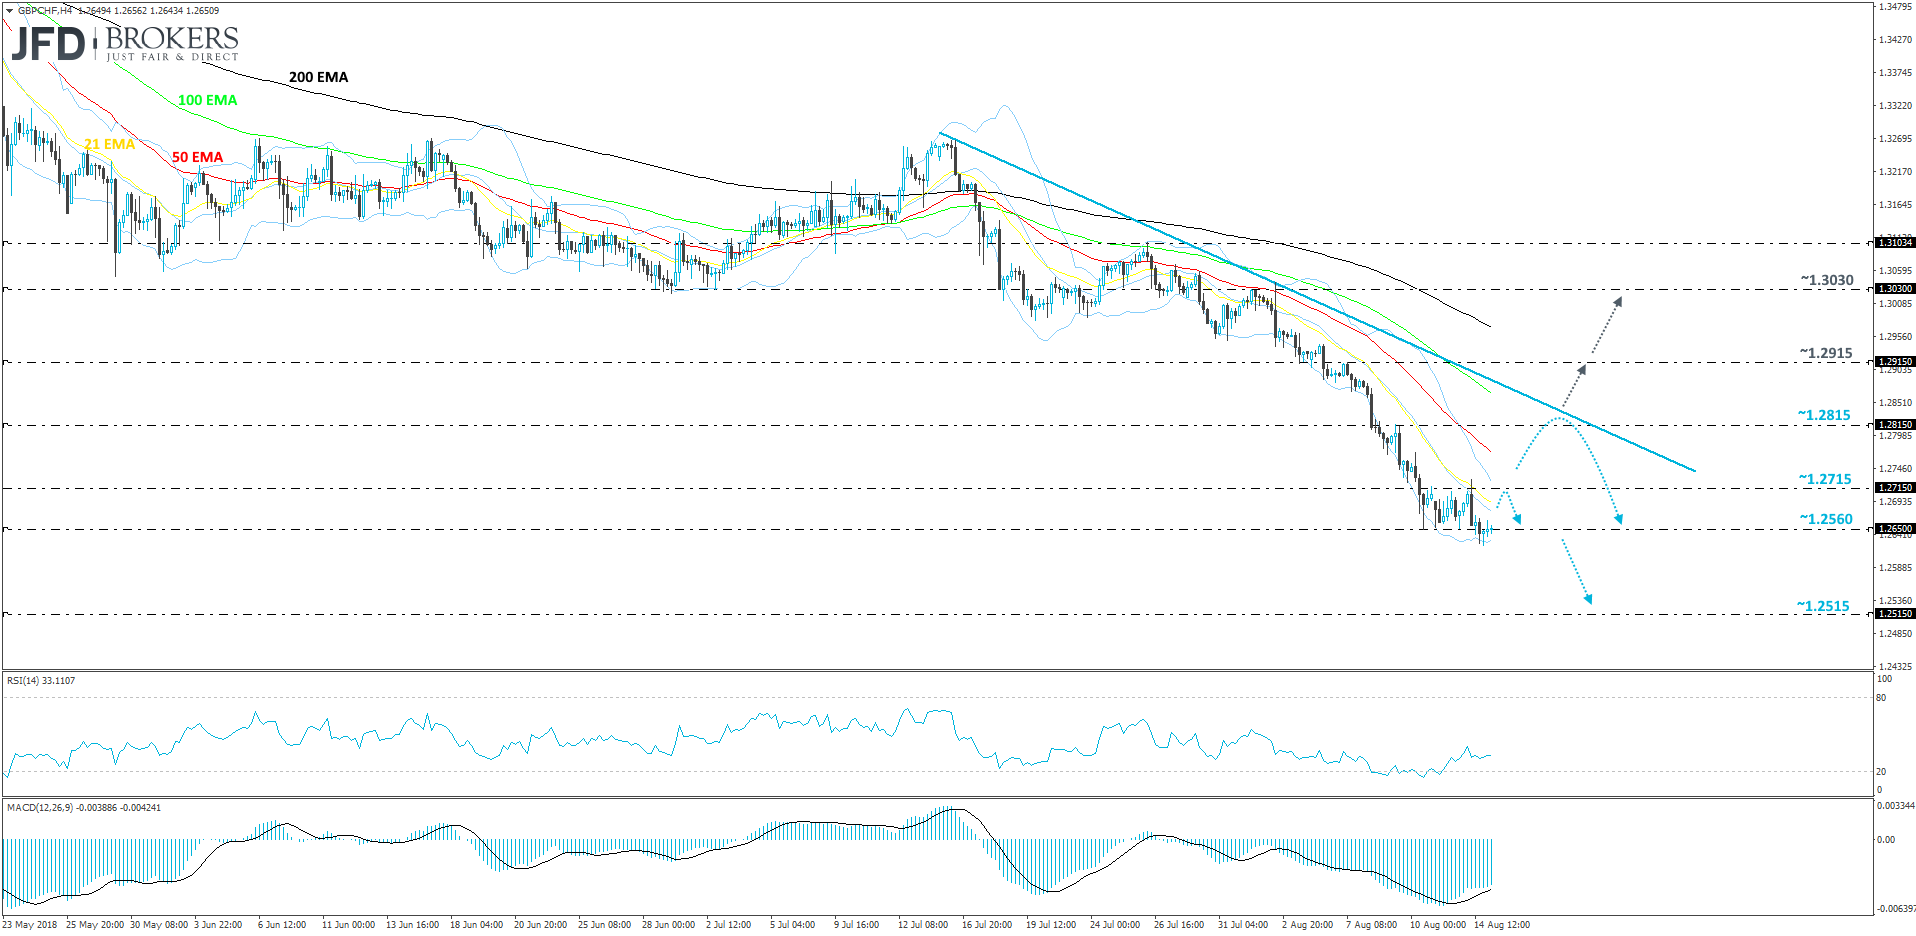
GBP/CHF was one of those pairs to show how weak has the British pound been lately. For now, it looks that nothing can stop this freefall. We can see that GBP/CHF is currently resting on newly-found support at 1.2650. Nevertheless, the pair is still trading below its tentative downside resistance line, taken from the peak of the 16th of July. Overall, we are still bearish on GBP/CHF, but we are not excluding a possibility of a small correction to the upside.
If GBP/CHF moves lower and closes below 1.2650, then this could open the path to the next potential area of support at 1.2515, marked by the high of the 7th of September last year. But as we said before, the pair could correct itself back to the upside, before dropping down again. The first good potential resistance zone to keep an eye on is the 1.2715, which continues to hold the rate from moving higher since the 10th of August. If, eventually, the level breaks, this could open the path to the 1.2815 hurdle, marked by the high of the 9th of August. Slightly above that GBP/CHF could meet the aforementioned downside resistance line, which could slow down the rate acceleration. The bears could take advantage of this and drive the pair down again.
If the abovementioned downside line gets broken and GBP/CHF closes above it, then this could mean that there is a chance to for it travel a bit higher, at least to the 1.2915 level, marked by the high of the 7th of August. A break of that level could set the stage for a test of a higher one at 1.3030 hurdle, which was the high of the 1st of August.
Looking at the RSI, even though below the 50 line, it has now bottomed and pointing upwards. The MACD also looks promising. Although it is below zero, the indicator has also bottomed, and it moved above its trigger line. All this puts a positive spin on the short-term outlook and it comes in line with the idea of a possible small correction to the upside.
US Retail Sales
The US will produce their retail sales numbers, both core and the headline. The core retail sales, which exclude autos, are expected to have remained stable for the month of July at +0.4%, the same as the previous. But unlike the core, the headline figure is expected to have declined two-and-half times, going from +0.5% to +0.2%. If the headline comes out as expected, then the number will be the lowest it was since April this year. In that scenario, the low number could reflect Trump’s protectionism and its effects on the economy, as he continues to put tariffs on foreign imports of consumer goods. If the data comes out weak, then we could see a bit of sellers jumping in, in order to take advantage of an overbought US dollar.
S&P 500 – Technical Outlook
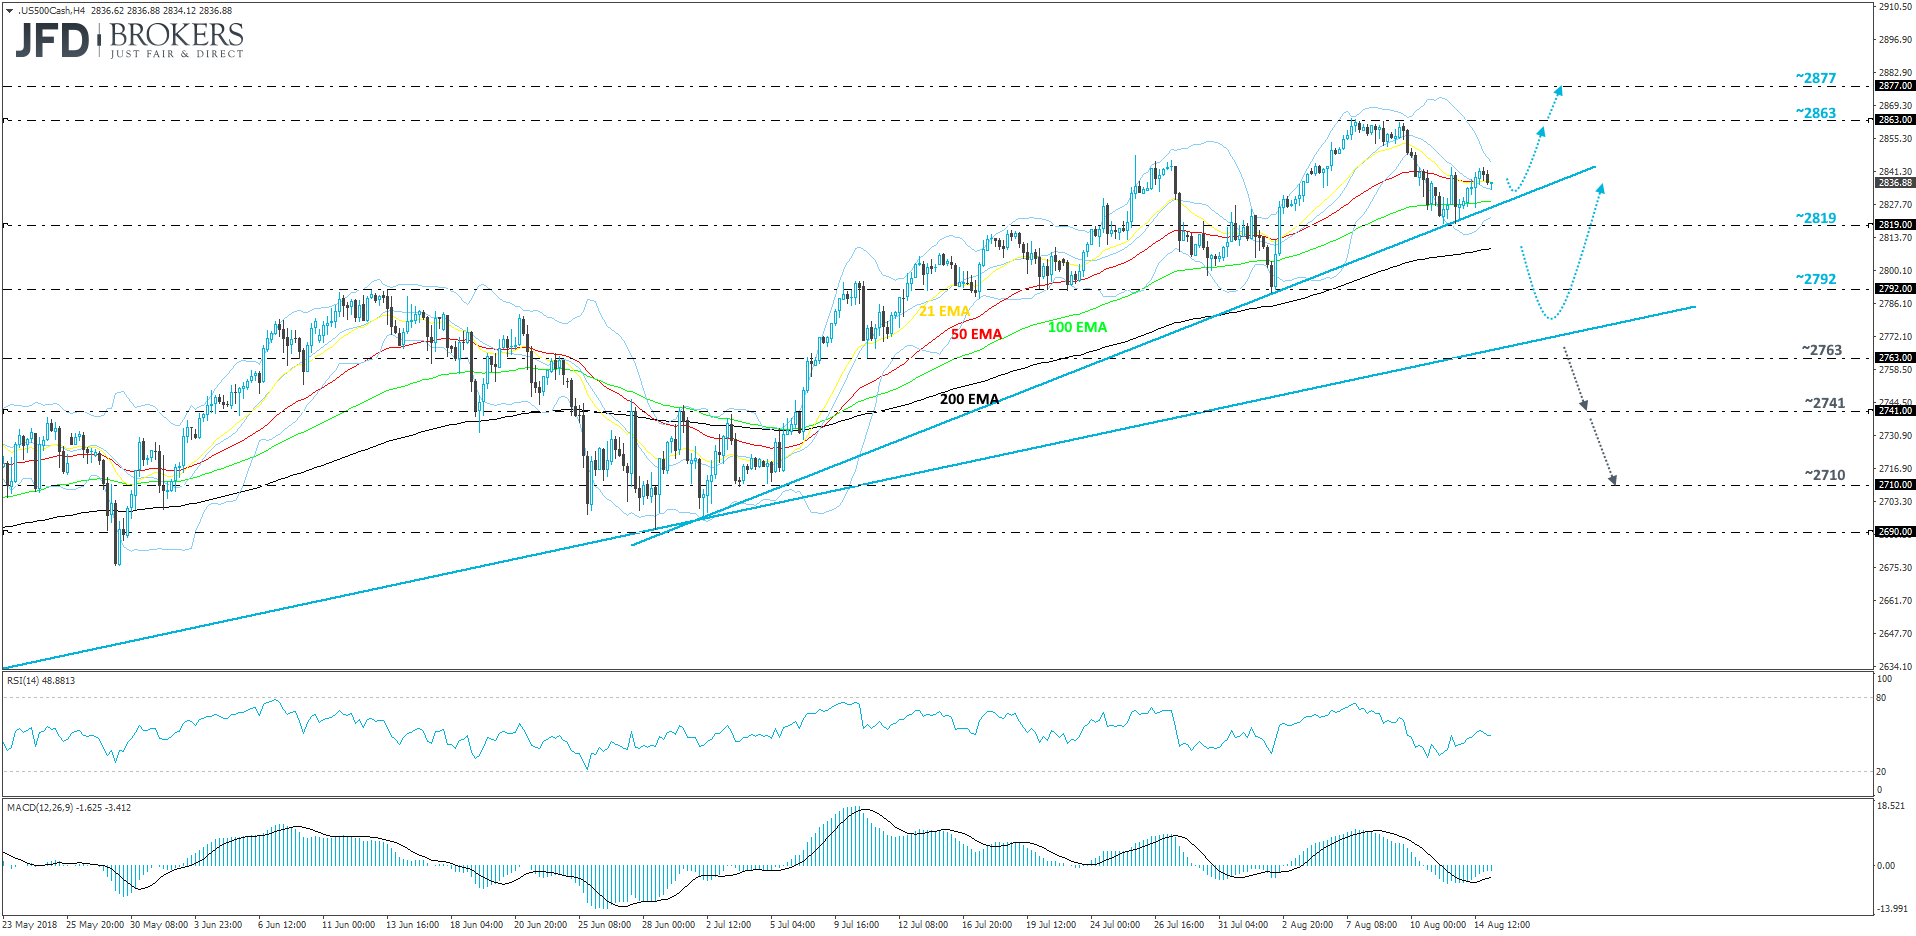
Last week, it looked like the S&P 500 might attempt to test its all-time high again at around 2877 level, which was reached on the 28th of January. But the index found strong resistance at 2863 and reversed south from there. That said, the S&P continues to trade above its short-term upside support line, taken from the low of the 2nd of July. As long as this line remains intact, we will stick to the upside.
On Monday, we saw the S&P 500 coming down and testing the aforementioned upside line and then bouncing off of it. This makes us believe that the index could try and make its way higher again, towards the 2863 resistance barrier, a break of which could open the way to the all-time high level at around 2877.
That said, even if the index breaks that upside support line, still the move lower could be temporary, as on the bigger picture, the S&P 500 continues to trade above its medium-term upwards moving trendline, drawn from the low of the 2nd of April. But before the index could reach that line, it would have to break the 2819 support zone, marked by the low of the 13th of August, and the 2792, which was the low of the 2nd of August. Only then the S&P 500 could start testing the medium-term upside trendline.
For us to turn bearish in the near term, we would need to see a break and a close below the previously mentioned upside trendline. This way, we could start examining possible lower support levels that could get tested. The first one on our radar could be the 2763 zone, marked by the low of the 10th of July. Further declines could lead to a test of the 2740 barrier, which acted as strong resistance between the 25th of June and the 5th of July. If the bears remain in the driver’s seat, then we could see the index falling towards the 2710 hurdle, marked by the low of the 5th of July.
As for the rest of today’s events
The United States will be delivering its weekly crude oil inventories number. The figure is expected to have dropped from the previous -1.351M barrels to -2.499M. If this will be the case, then it would mean that the stock of crude oil held has gone down by almost 1.85 times. This could potentially affect the price of oil in a positive way.
Disclaimer:
The content we produce does not constitute investment advice or investment recommendation (should not be considered as such) and does not in any way constitute an invitation to acquire any financial instrument or product. JFD Brokers, its affiliates, agents, directors, officers or employees are not liable for any damages that may be caused by individual comments or statements by JFD Brokers analysts and assumes no liability with respect to the completeness and correctness of the content presented. The investor is solely responsible for the risk of his investment decisions. Accordingly, you should seek, if you consider appropriate, relevant independent professional advice on the investment considered. The analyzes and comments presented do not include any consideration of your personal investment objectives, financial circumstances or needs. The content has not been prepared in accordance with the legal requirements for financial analyzes and must therefore be viewed by the reader as marketing information. JFD Brokers prohibits the duplication or publication without explicit approval.
CFDs are complex instruments and come with a high risk of losing money rapidly due to leverage. 75% of retail investor accounts lose money when trading CFDs with the Company. You should consider whether you understand how CFDs work and whether you can afford to take the high risk of losing your money. Please read the full Risk Disclosure.
Copyright 2018 JFD Brokers Ltd.